
Monitoring array output is pretty simple with my TED5000. Once I extended the computer room circuit up to the attic, I installed a new MTU, clamped the circuit taps around the array hot wires and registered everything using the web interface. The results were instantaneous:
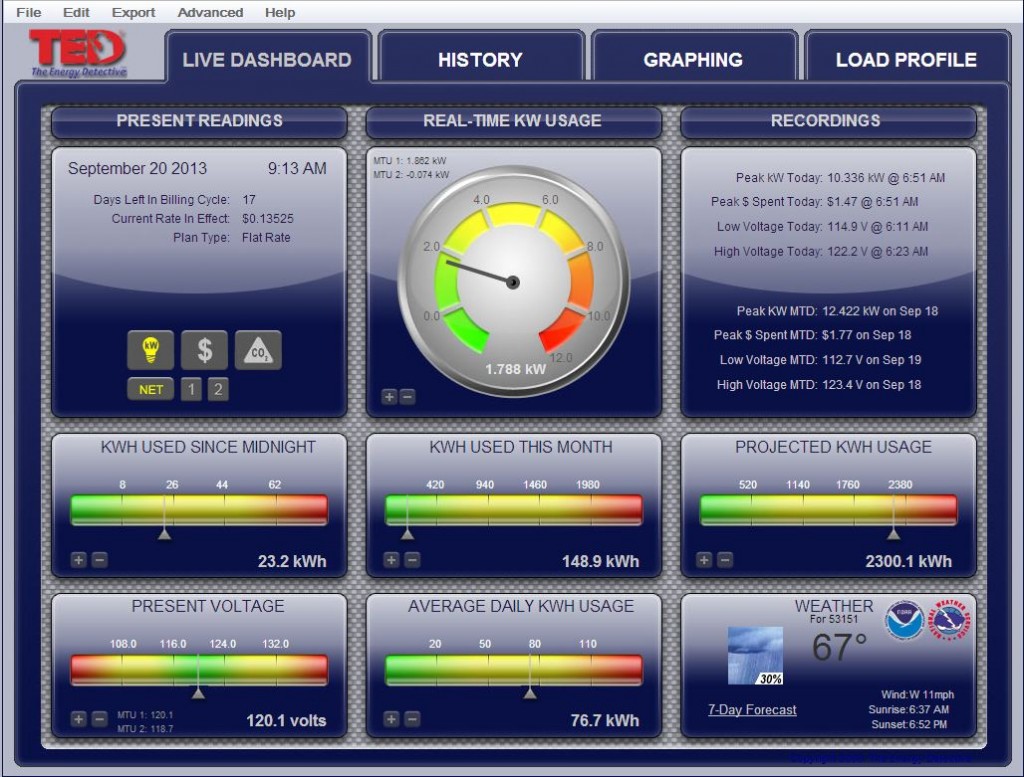
TED was now showing Net energy usage and I could easily switch between Demand (MTU 1), and Generation (MTU 2).
Historical results began updating right away too. Here’s the minute graph:
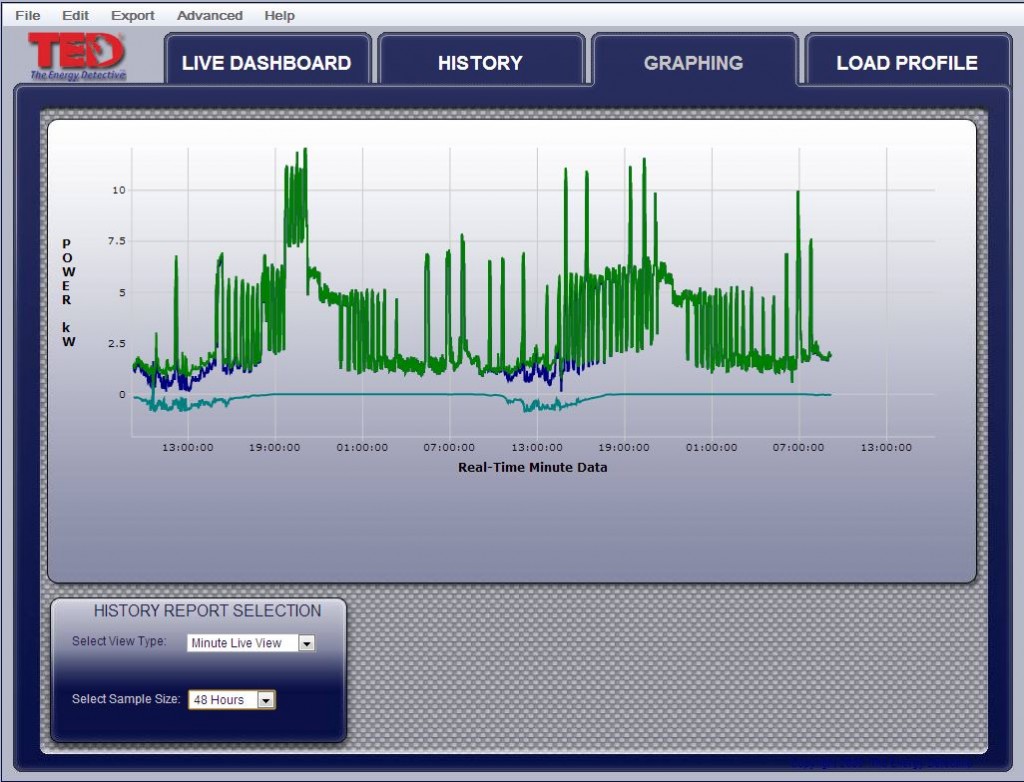
Green is my energy usage and dark blue is my net energy usage. The aqua blue line represents power from the array. Not too bad for two mostly cloudy days! Here’s the monthly plot:
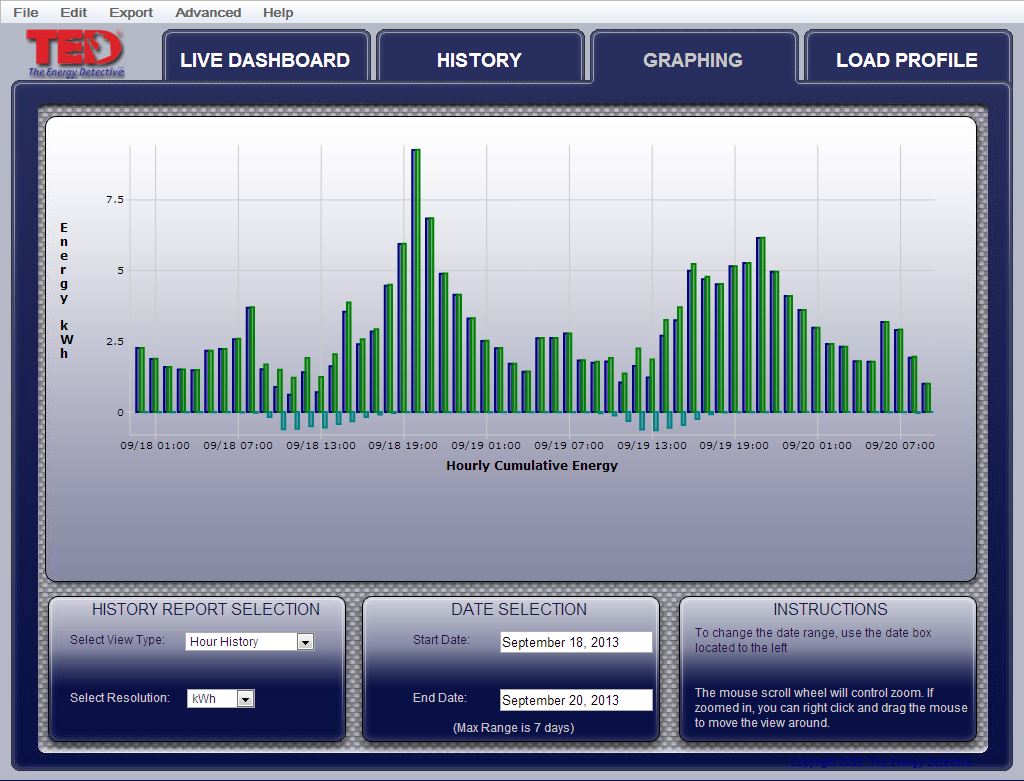
Data is stored historically by month as well so I should be able to build up a pretty good picture over time.
Of course, I have mobile monitoring capabilities too using an excellent app called EnergyViewer for TED5000 by BCS Software.
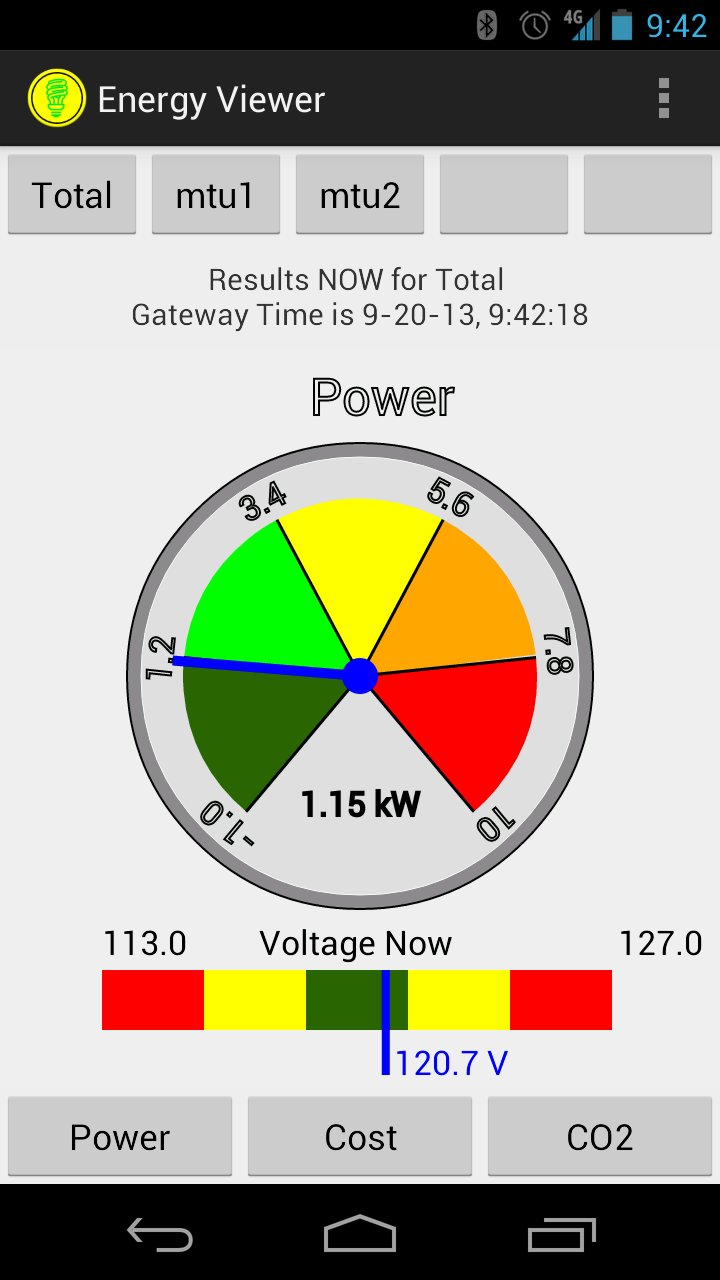
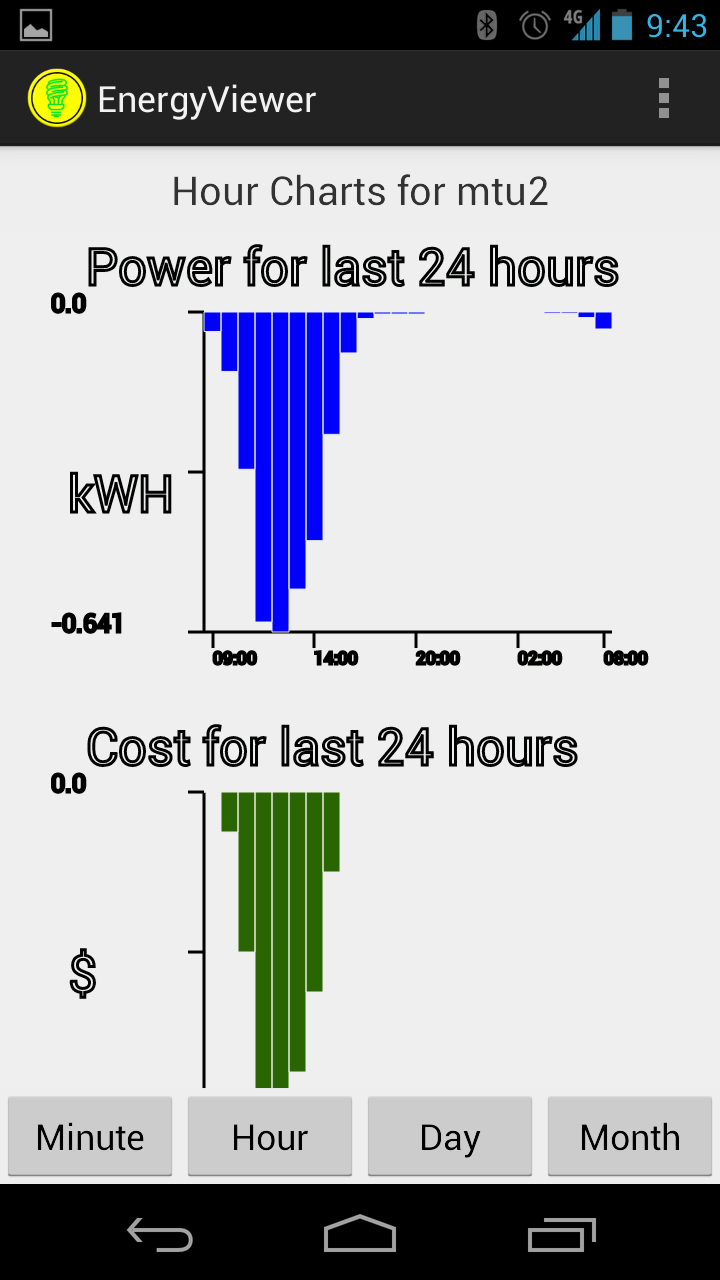 This cool little app allows me to see pretty much everything the TED website shows.
All in all a pretty good deal to at $.99. There’s a tablet version too which adds multiple power graphing and historical displays to take advantage of a tablet’s larger size.
It does require that you map your TED5000 gateway to the internet however, but I prefer this to using a cloud based provider.
I’m currently debating whether I’ll also begin using Enphase Envoy which can give me detailed statistics by solar panel. At $500 – $600 however, I may be considering this for quite some time….