
PVWatts is a good tool that uses average sunshine data to predict solar collector efficiency, but there’s another important factor to the equation: shading. Once you determine the shading factor, the PVWatts data can be multiplied by the sun percentage to more accurately predict energy output. The idea here is to find the best spot on your property to mount your solar array. In some cases, once a Solar survey is completed, it may even become clear that solar isn’t a practical solution.
So, on to the survey. This is actually a fun exercise that doesn’t take too long to accomplish either. First, you need to determine true south. This is a pretty easy task that leverages “solar noon” or the point during the day where the sun is highest in the sky. At that time, any shadow from a vertical object points true North/South. NOAA has a cool calculator that allows you to determine the exact time of day that solar noon occurs for the proposed solar site too. It’s called the NOAA Solar Calculator and its pretty easy to use. 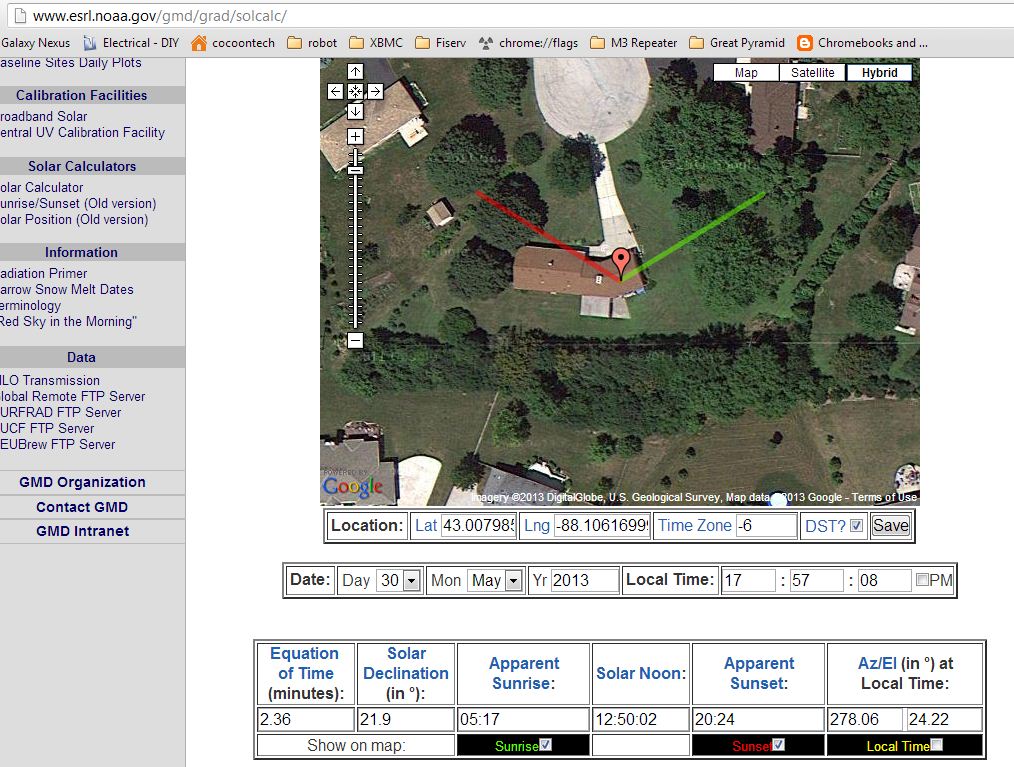 Just zoom the satellite image to your proposed site and drop the large pin on the exact location. Voila, solar noon is displayed! There’s other cool stuff you can display too such as the sunrise and sunset angles. These are the red and green lines shown on my image above. What you want to do with these is to first change the date to display for the summer solstice then note the obstructions. In my case, you can see the two maple trees to the left and right of the house along with the woods behind me are potential shading factors.
Next, you need a plumb bob whose line will cast that vertical shadow in a true north/south direction at noon. In my case, I adjusted the plumb bob so the shadow cast by its line fell on the garage wall and across the patio floor. I then placed a protractor against the wall so that the shadow cast by the line was centered. The protractor now read out the sun angle in relation to the garage. At 12:50:02, I simply read the angle off and adjusted from 180 degrees. Mine showed exactly 20 degrees West (right of center) which means that my array will face at 160 degrees. This was pretty much a verification of my original estimate.
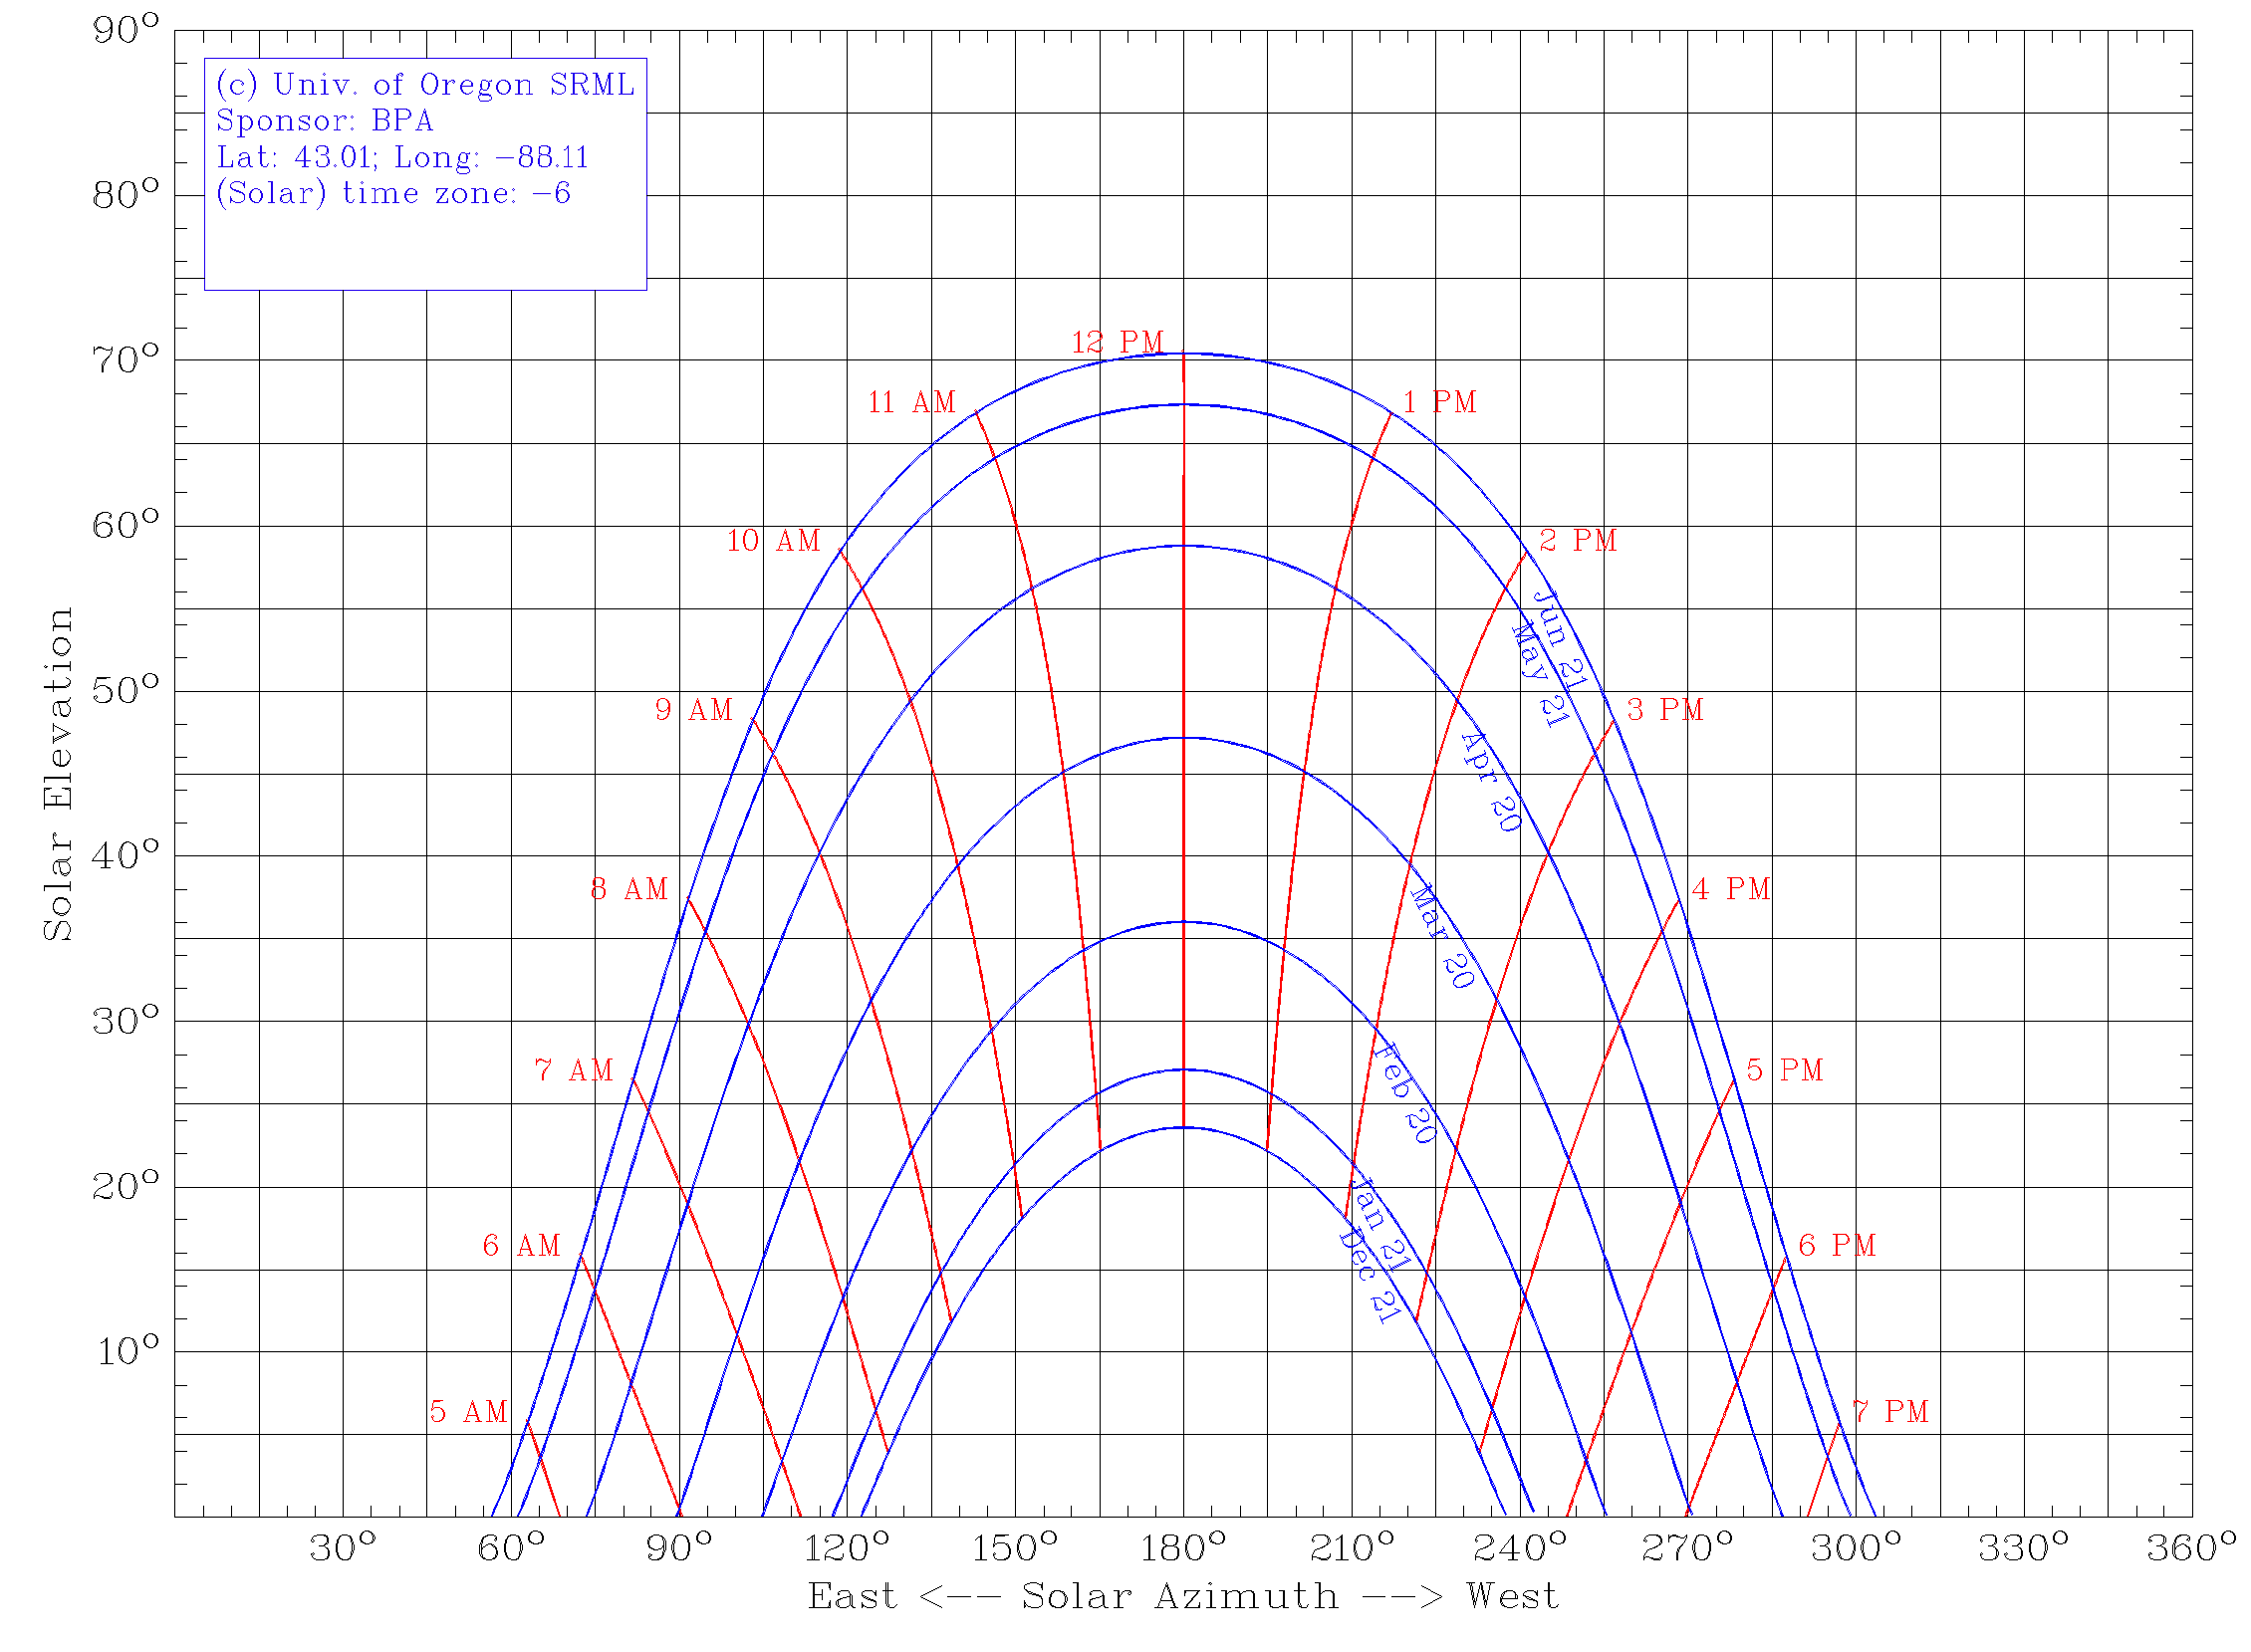
Before closing the calculator, make a note of the latitude/longitude displayed because we need that for our next exercise which is to obtain a Sun Chart for the proposed site. Sun Charts are available here: http://solardat.uoregon.edu/SunChartProgram.html . Just enter the latitude/longitude from the NOAA calculator, use default settings for everything else, download the pdf version of the Sun Chart, and print it out. The Sun Chart shows the position (azimuth and elevation) of the sun for every minute of the year — all on one piece of paper! It is worth spending a few minutes studying the Sun Chart, and understanding how it works. It’s a great way to check your understanding of the movement of the sun in the sky throughout the day and the year. Here’s mine:
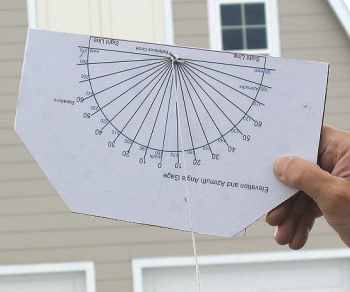
Now comes the fun part, plotting your shaded areas on the chart to get a visual representation of the total shading factor and allow you to estimate the shading percentage. You will first need to make gauges to measure the sun azimuth and elevation angles. Download this Solar Elevation and Azimuth Gauge, and print out two copies of it.
Make the Elevation gauge
- Paste one copy onto a piece of cardboard.
- Trim the cardboard along the Site Line (you will site along this edge for elevation measurements)
- Put a small nail through the center of the Reference Circle where all the lines meet
- Tie one end of a light string to the nail, and the other end to any small weight (e.g. a bolt or nut)
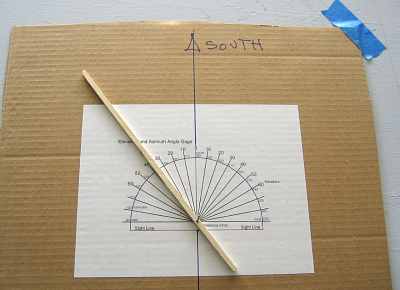
Make the Azimuth angle gauge
- Paste the other copy onto another piece of cardboard.
- Find a thin, straight piece of wood (e.g. a wood pencil) and drill a small hole near one end. You will site along this pointer to measure azimuth angles.
- Put a small nail through the drilled hole, and then through the center of the reference
circle.
Now that you have the two tools you need, go to the center of your proposed solar site and plot a dot showing the top of visible shade every thirty degrees on your solar chart. Start at the leftmost blue line on the chart and end at the rightmost. Essentially, adjust the angle of the azimuth gauge then look along the line shown. Now sight along the top of your elevation gauge to the top of any obstruction that can be seen. Read out the angle and plot the point on the sun chart. When finished, simply connect the dots and you will obtain a visual representation of your shading factor. I haven’t done mine yet; its a weekend project but here’s an example of what a completed sun chart with shading factor looks like:
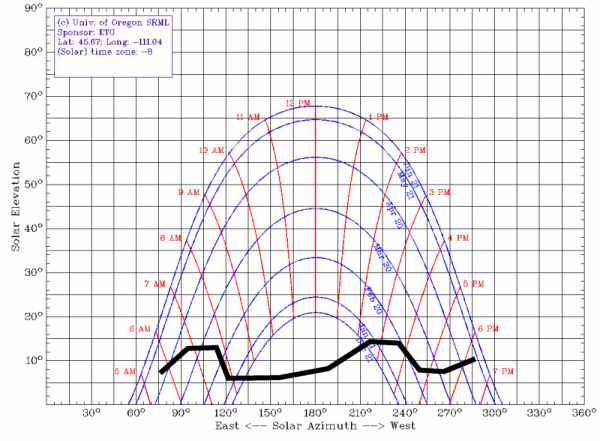
It’s pretty easy to estimate the total shading factor now. Remember, you really want no more than 10% total shading on your graph. In fact, if you have more than 10% then you may not qualify for any solar related rebates or incentives. Also remember that trees create shade in the summer and aren’t necessarily a factor in the winter. In the chart above, the big bump at the left is a tree which really won’t affect the sun in February.
Have fun doing your own solar survey and stay tuned for more on our own installation!